




Press Ctrl + Shift + I (or F12) on Windows and Linux, or Cmd + Option + I on a Mac, and Chrome opens its Developer Tools panel right where you left it. That’s the short version of the developer tools chrome shortcut, and it’s the one worth memorizing first. But DevTools isn’t one screen, it’s a whole workbench, and Chrome ships separate shortcuts for jumping straight to the Console, starting Inspect Element mode, and opening the Command Menu that runs everything from screenshots to saved scripts.
This guide walks through each of those shortcuts for Windows, Linux, and Mac, what to do when the shortcut stops responding, and how to take a screenshot without installing anything. Near the end, there’s a section on a problem DevTools shortcuts don’t solve: keeping the tabs open around your debugging session safe when Chrome reloads, crashes, or you close the wrong window mid-test.
What Is the Developer Tools Chrome Shortcut?
The developer tools Chrome shortcut is Ctrl + Shift + I or F12 on Windows and Linux, and Cmd + Option + I on a Mac. All three open the same DevTools panel, docked to whichever tab is currently active, showing whatever panel (Elements, Console, Network, and so on) was open the last time you used it.
That single combo covers most of what people are really asking for when they search chrome shortcut developer tools, developer tools in chrome shortcut, or chrome shortcut for developer tools. They’re the same request phrased a few different ways, and they all land on the same answer. Where it gets more specific is when you want DevTools to open somewhere other than its default view, which is where the shortcuts below come in.
Here’s the quick reference, sourced from Chrome’s own DevTools keyboard shortcuts documentation, followed by a breakdown of what each one is actually for.
| Situation | Windows / Linux | Mac |
|---|---|---|
| Open DevTools (default panel) | Ctrl+Shift+I or F12 | Cmd+Option+I |
| Open straight to Console | Ctrl+Shift+J | Cmd+Option+J |
| Open in Inspect Element mode | Ctrl+Shift+C | Cmd+Shift+C |
| Open the Command Menu | Ctrl+Shift+P | Cmd+Shift+P |
- Full panel. Ctrl+Shift+I or F12 (Cmd+Option+I on Mac) opens DevTools to its last-used panel.
- Console only. Ctrl+Shift+J (Cmd+Option+J on Mac) jumps straight to error messages and logs.
- Element picker. Ctrl+Shift+C (Cmd+Shift+C on Mac) starts point-and-inspect mode immediately.
How Do I Open DevTools on Windows or Linux?
On Windows or Linux, Chrome opens DevTools when you press Ctrl + Shift + I, or when you press the single key F12. Both do the same thing: they open the panel to whatever view you last had open, docked in whatever position you last left it.
There’s no functional difference between the two, so pick whichever is easier for your hands. F12 is one key, which is convenient if you’re jumping in and out of DevTools constantly while you code. Some keyboards and laptops give the F-row a secondary job by default (volume, brightness, that sort of thing) which can make a single function key feel inconsistent depending on your settings. If that’s the case for you, Ctrl + Shift + I is the more reliable habit to build, since it doesn’t depend on how your F-keys are configured.
Either shortcut works from any regular webpage. It won’t do anything if focus is sitting somewhere DevTools can’t reach, like a browser dialog box or the address bar. If you press the shortcut and nothing happens, click once on the page itself to make sure the tab has focus, then try again.
This is also the shortcut most people mean when they search for a shortcut key for developer tools in Chrome. It’s the default, all-purpose entry point, and the one worth building muscle memory around before you bother with the more specific variants below. If you’re also trying to clean up how you switch between tabs while you work, our guide to Chrome’s keyboard shortcuts rounds up the rest of the ones worth knowing.
How Do I Open DevTools on a Mac?
On a Mac, the shortcut is Cmd + Option + I. It opens the same DevTools panel as the Windows and Linux shortcut, just with Mac’s modifier keys standing in for Ctrl.
If you’re new to a Mac keyboard, the Option key is usually the one marked with a small symbol next to Command. It’s easy to grab Control by mistake if you’re used to Windows, since the layout puts Control closer to the corner on a Mac than it does on most PC keyboards. Give it a second look the first few times until the combination feels automatic.
This is also the combination people mean when they search for a chrome dev tool shortcut on a Mac specifically, since Mac shortcuts for the same feature almost always swap Ctrl for Cmd and add Option where Windows uses a plain modifier. That pattern holds for the Console shortcut too, but Inspect Element mode swaps in Shift instead of Option, which trips people up because it breaks the pattern. More on that in a moment.
One more Mac-specific note: if you’ve remapped Caps Lock or function keys, or you run window-management or clipboard software that intercepts global shortcuts, it can quietly eat the Cmd+Option+I combination before Chrome ever sees it. If the shortcut worked yesterday and stopped today, check anything you installed recently before assuming Chrome broke.
How Do I Jump Straight to the Console Panel?
Press Ctrl + Shift + J on Windows or Linux, or Cmd + Option + J on a Mac, and Chrome opens DevTools with the Console panel active, skipping whatever panel you had open before.
This is the shortcut worth reaching for when something on a page looks broken and you want to check for JavaScript errors without hunting through DevTools’ own tabs first. It’s one keystroke faster than opening DevTools generally and then clicking over to Console, which matters more than it sounds like if you’re doing it dozens of times a day.
- Open the page with the problem. Click into the tab so it has focus.
- Press the Console shortcut. Ctrl + Shift + J on Windows/Linux, or Cmd + Option + J on a Mac.
- Read the output. Errors and warnings show up in red and yellow; reload the page if you need a fresh log.
Note the pattern: it’s the same modifier as the main DevTools shortcut, with J swapped in for I. Once you’ve got the main shortcut down, this one is a small variation, not a new thing to memorize from scratch. It’s a good pairing with a hard reload when you suspect a cached script is the actual culprit — our guide to Chrome’s reload shortcut covers the difference between a normal refresh and a full cache-busting one.
How Do I Open DevTools in Inspect Element Mode?
Press Ctrl + Shift + C on Windows or Linux, or Cmd + Shift + C on a Mac, and Chrome opens DevTools with the element picker already active, so your very next click or hover on the page selects that element in the Elements panel.
This is the fastest way to answer “what element is this, and what CSS is doing that to it” without manually digging through the DOM tree. It’s especially useful on pages with deeply nested layouts, where clicking through the Elements panel by hand to find one specific block would take longer than the whole task is worth.
If you already have DevTools open, you don’t strictly need the shortcut. There’s a separate element-picker control inside DevTools itself that does the same job. The shortcut’s real value is opening straight into that mode from a page where DevTools isn’t open yet, in one step instead of two.
What Does the Command Menu Shortcut Do?
Press Ctrl + Shift + P on Windows or Linux, or Cmd + Shift + P on a Mac, and Chrome opens the Command Menu — a search box for running DevTools actions without hunting through menus. It works whether DevTools was already open or not; pressing it opens DevTools and the Command Menu together if needed.
Typed into that box, a few characters change what it searches. Delete the > Chrome puts at the start by default and type ? instead, and it lists other things the box can search for. Delete the > and type a filename instead of a command, and it searches your project’s files rather than running an action. Type ! followed by the name of a saved Snippet, and it runs that Snippet immediately — handy if you keep a small library of debugging scripts you reuse across projects.
| Type this | What happens |
|---|---|
| A word or phrase (default) | Runs a matching DevTools command |
? (after deleting >) |
Lists other available search modes |
A filename (after deleting >) |
Searches your project’s files |
! + Snippet name |
Runs that saved Snippet |
Snippets live in the Sources panel. The Command Menu can run a Snippet, but you still create and edit Snippets themselves in the Sources panel, not through the Command Menu box.
This is the part of the developer tools shortcut Chrome offers that most people never touch, mostly because it looks like a plain text box rather than a feature. Once you know it’s there, it turns into the fastest way to reach for anything from a screenshot command to a saved script, all without lifting your hands off the keyboard.
How Do I Take a Screenshot Using DevTools?
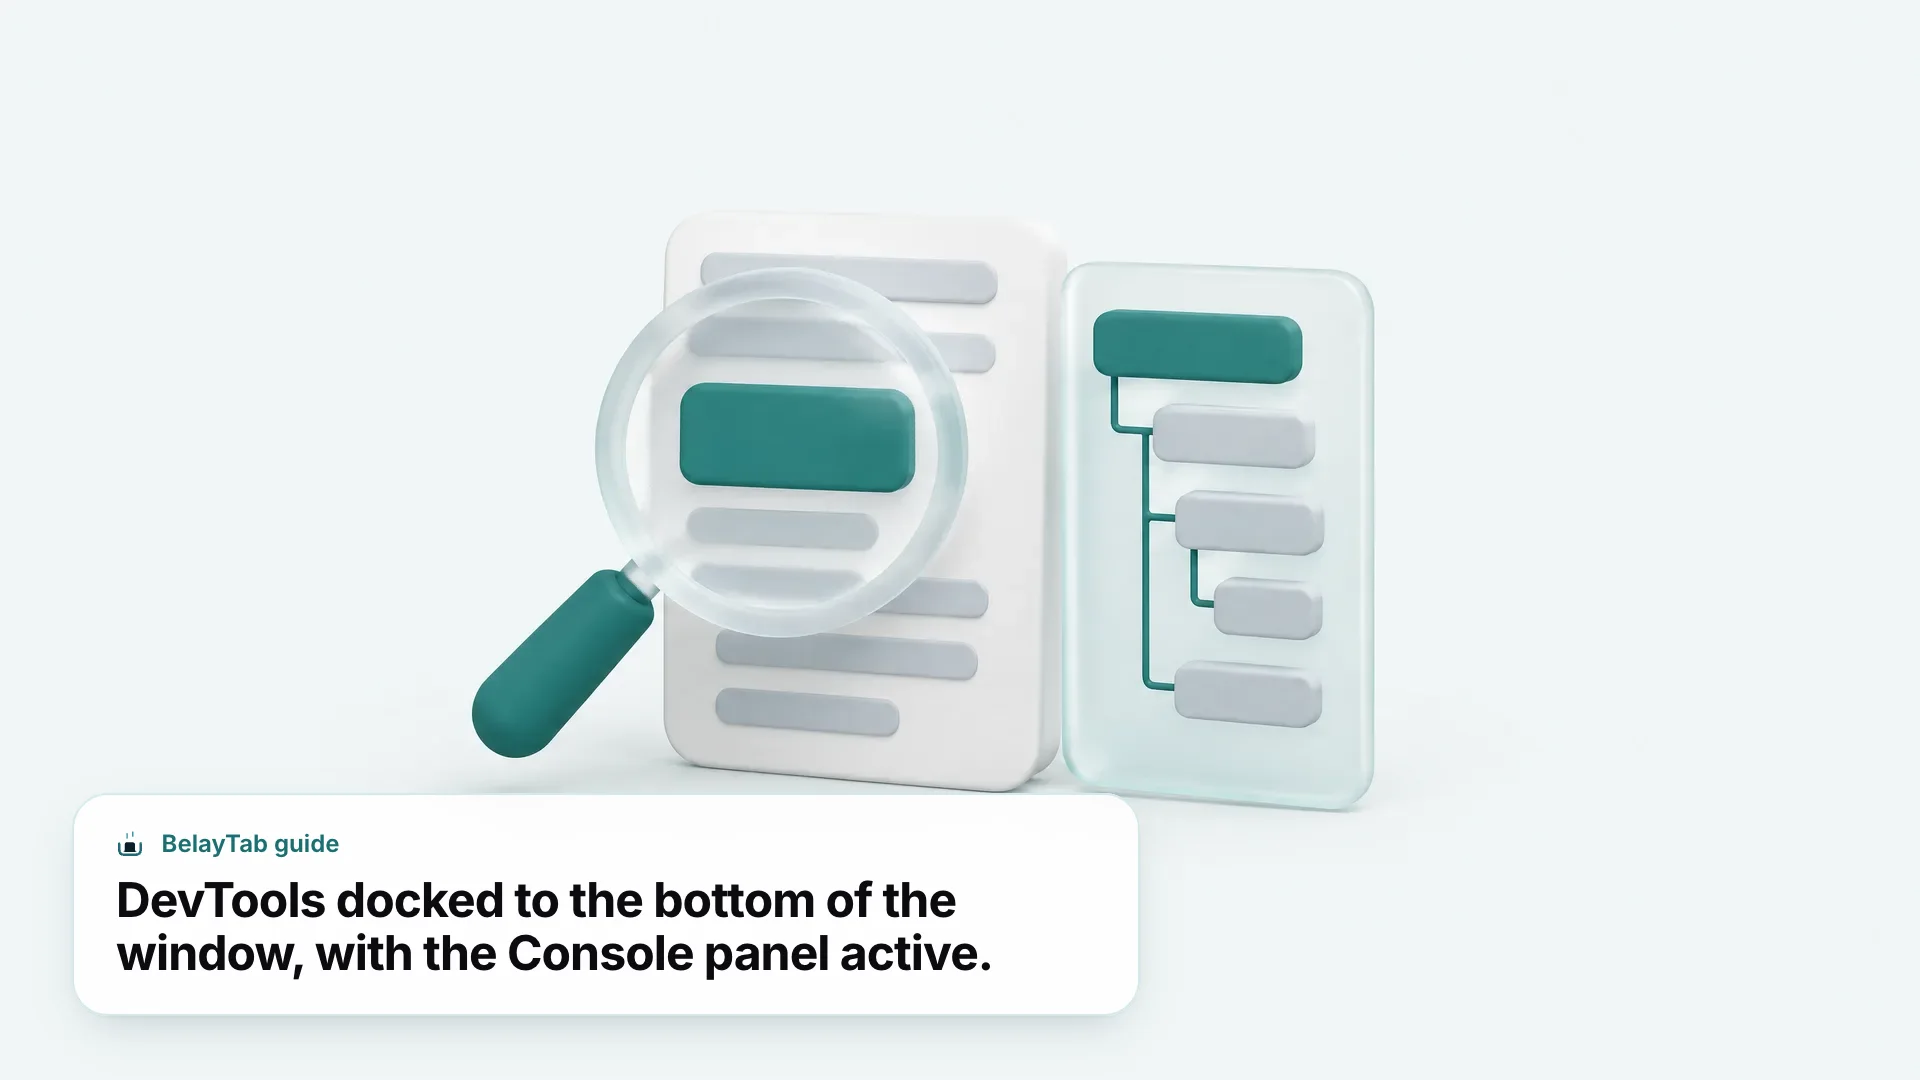
Open the Command Menu with Ctrl + Shift + P (Cmd + Shift + P on Mac), type “screenshot,” and select “Capture area screenshot.” Chrome lets you drag a box around exactly the part of the page you want, then saves that selection as an image — no extension required.
- Open the Command Menu. Ctrl + Shift + P, or Cmd + Shift + P on a Mac.
- Search for the command. Type “screenshot” and pick “Capture area screenshot.”
- Drag to select. Click and drag around the exact region of the page you want captured.
Docked DevTools only. Area screenshot capture does not work if DevTools is undocked from the browser window. Dock it back to the bottom or side of the window before trying again.
DevTools’ own documentation also walks through capturing screenshots four different ways: a full-page screenshot, a single node from the Elements panel (including one taller than your visible screen) and a screenshot with a device frame added while you’re emulating a phone or tablet. Each of those follows the same starting point: open the Command Menu and search from there, rather than digging through a separate menu.
None of this needs a screenshot extension installed, which is worth knowing if you’re trying to keep a clean browser profile or you’re on a work machine where installing new extensions requires approval. It’s slower than a dedicated screenshot tool for everyday use, but for grabbing a quick image of a bug to paste into a ticket, it’s already sitting inside the browser.
Why Isn’t My Developer Tools Shortcut Working?
A handful of things can stop the shortcut key for developer tools in Chrome from doing anything, and most of them have nothing to do with Chrome being broken.
Focus is the first thing to check. If your cursor is sitting in the address bar, a browser dialog, or a separate application entirely, Chrome’s page shortcuts won’t fire. Click once on the actual page content, then try the combination again.
Extensions are the second most common cause. Some extensions register their own global keyboard shortcuts, and depending on install order, one of them can end up claiming a combination Chrome would otherwise use for DevTools. If you’ve recently added an extension and the shortcut stopped working right around then, check its shortcut settings — our guide to Chrome’s extension shortcut keys covers how to see and change what each extension has claimed.
Third, try the alternate combination before assuming anything is wrong. If F12 does nothing, try Ctrl + Shift + I instead, since some keyboards route F-keys through a media-key layer first. And if you’re on a Mac and Cmd + Option + I seems dead, double-check you’re not pressing Control instead. It’s the single most common Mac mix-up with this shortcut.
If none of that explains it, a full Chrome restart clears out most temporary keyboard-handling weirdness. That’s a reasonable troubleshooting step for a stuck shortcut — just be aware that restarting Chrome closes and reopens every window, which is its own small risk if you’ve got tabs open that you haven’t saved anywhere.
How Do I Dock, Undock, or Close DevTools?
You close DevTools by pressing the same shortcut you used to open it — Ctrl + Shift + I, F12, and Cmd + Option + I all toggle the panel closed the same way they toggle it open.
Where DevTools sits is a separate question from whether it’s open. It can dock to the bottom of the window, to a side, or pop out into its own floating window entirely, and which one makes sense depends on what you’re doing. A bottom dock gives you more horizontal room to read the Elements tree, which helps on deeply nested pages. A side dock keeps more of the page’s height visible, which is useful when you’re watching layout shift as you toggle CSS. An undocked window is the one to reach for if you’ve got a second monitor. You get a full-size DevTools window without shrinking the page you’re testing.
That last option comes with a real trade-off worth remembering from the section above: undocking disables area screenshot capture through the Command Menu. If you rely on that screenshot workflow regularly, it’s worth keeping DevTools docked as your default and only popping it out for the specific tasks (like watching Network activity across a long session) where the extra screen space matters more than the screenshot shortcut does.
None of the docking choices affect which keyboard shortcuts work. Console, Inspect Element, and the Command Menu all behave the same whether DevTools is docked or floating; only the area screenshot feature cares about dock state specifically.
How Do I Keep My Tabs Safe While Debugging in Chrome?
DevTools shortcuts don’t close tabs or windows on their own, but the workflow around them often does. A typical debugging session means forcing hard refreshes, opening a fresh Incognito window to rule out cached data or extensions, restarting Chrome to clear stuck state, and sometimes closing and reopening the exact window you’re testing in. Any one of those is a moment where a window you meant to keep gets closed along with everything else in it — see our guides on the hard-refresh shortcut and opening an Incognito window if those are part of your usual routine.
Chrome’s own tools handle the last closed tab reasonably well, but they don’t help once you’ve closed several windows over the course of an afternoon, or once Chrome has crashed outright and you’re not sure what was even open. That gap has nothing to do with DevTools and everything to do with how many windows a real debugging session churns through.
BelayTab covers that gap without changing anything about how you use DevTools. It’s a free browser extension that saves your open windows as named sessions — one click, or a keyboard shortcut of its own, Ctrl + Shift + S (Cmd + Shift + S on Mac). It also snapshots every open window automatically, every five minutes and whenever a window closes, so a session you forgot to save by hand is still recoverable afterward from the Recovery screen, alongside anything Chrome itself remembers as recently closed. You can see the full list of BelayTab’s own shortcuts on its keyboard shortcuts reference.
It’s worth being clear about what this does and doesn’t fix. BelayTab can’t stop Chrome from crashing, it can’t recover tabs that were open before you installed it, and it won’t fix a frozen browser by itself — for that, our guide on Chrome freezing or not responding is the better next stop. What BelayTab does is make sure the tabs survive the crash, the restart, or the window you closed by mistake, backed by automatic snapshots running the whole time in the background, so debugging one page doesn’t cost you the twenty tabs you had open around it. It’s free, with no account and no limits, and you can install it in a couple of minutes.